Physical Address
304 North Cardinal St.
Dorchester Center, MA 02124
Physical Address
304 North Cardinal St.
Dorchester Center, MA 02124

Global solar installations surged 64% in the first half of 2025, led by China’s record 256 GW expansion. From India to Australia, nations are racing to scale renewables as solar reshapes the global clean energy map faster than ever before.
China’s rapid rise in solar power has redefined the pace of the global energy transition. In just the first half of 2025, the country added 256 GW of new solar capacity more than the rest of the world combined, cementing its position as the world’s leader in clean energy deployment.
According to the clean energy think tank Ember, global solar installations reached 380 GW by the end of June, a 64% increase compared with the same period in 2024, when 232 GW was installed. In 2024, it took until September for the world to surpass 350 GW; in 2025, that mark arrived by mid-year.
Solar is now the planet’s fastest-growing source of electricity. Ember reports that global solar output in 2024 rose 28% (+469 TWh) over 2023, a trend that shows no sign of slowing. The scale of China’s expansion not only demonstrates its manufacturing and policy strength but also signals a decisive shift in where the momentum of the clean-energy future now lies.
At the centre of this clean energy acceleration stands China, which deployed a staggering 256 GW of new capacity in just six months more than twice the rest of the world combined. That equals 67% of global additions, up from 54% a year earlier.
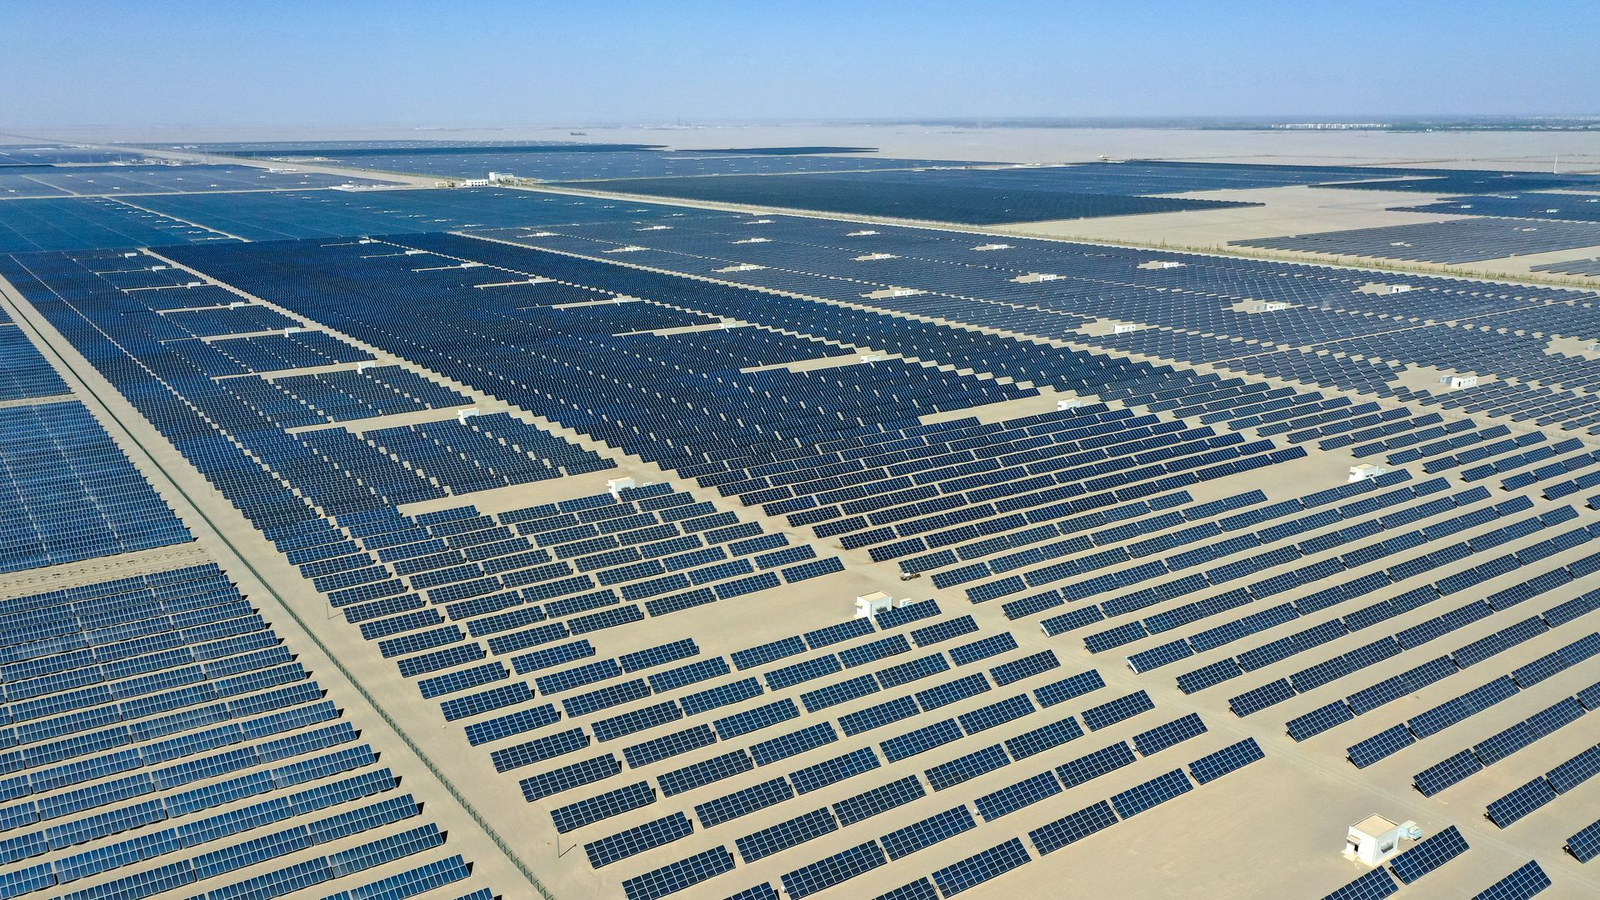
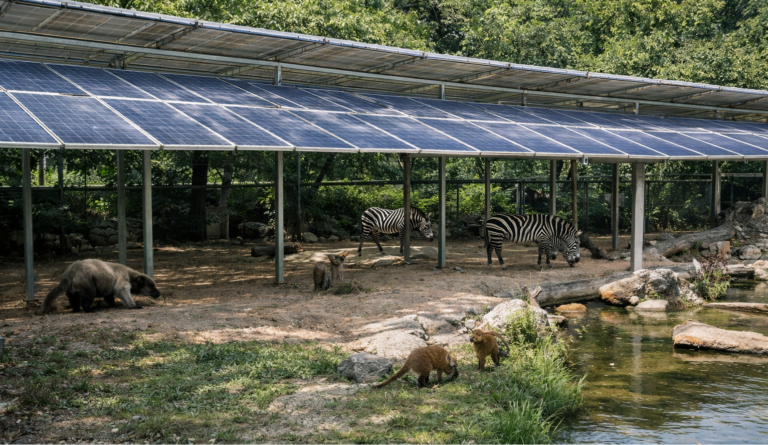
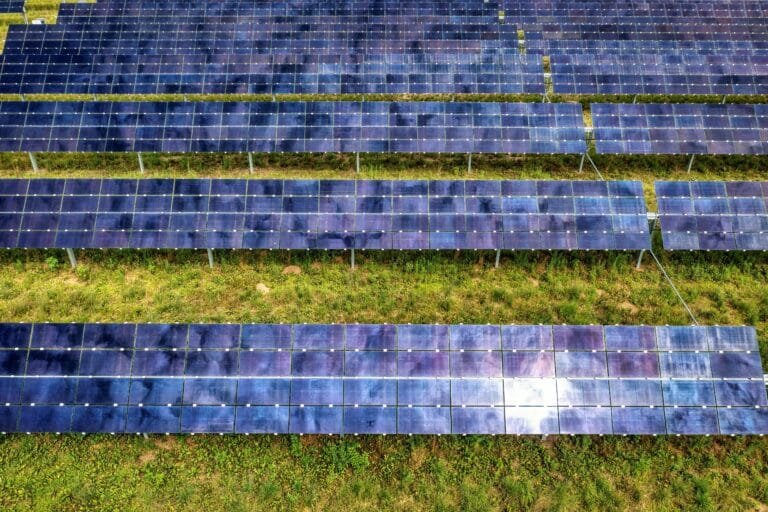
Mega-projects in the Tengger and Qinghai deserts, paired with booming rooftop and agrivoltaic installations, illustrate the country’s multi-track approach. A combination of domestic manufacturing dominance, low-cost financing, and firm policy direction has made 2025 the fastest renewable expansion in human history.
While China’s clean energy scale is unmatched, several other leaders are pursuing distinct pathways.
India remains the second-fastest-growing market, adding 24 GW in H1 2025. Utility-scale projects in Rajasthan and Gujarat are expanding alongside rooftop and agricultural solar. With cumulative capacity surpassing 110 GW, India is on course toward its 280 GW by 2030 target. The government’s Production Linked Incentive (PLI) scheme is spurring domestic module manufacturing and reducing import reliance.
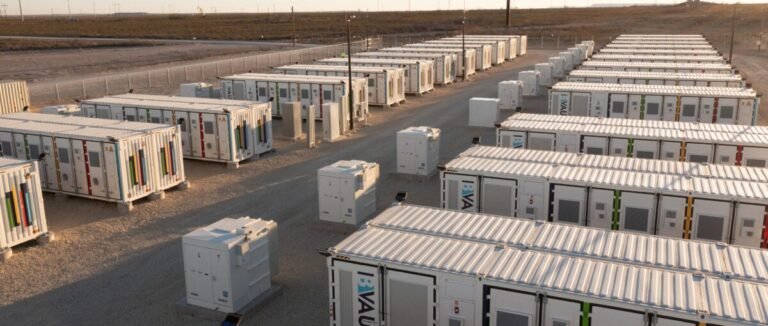
The United States added 21 GW in the same period, a 4% increase year on year. Despite generous Inflation Reduction Act incentives, developers face grid interconnection delays and trade-policy friction. The U.S. Energy Information Administration expects another 21 GW to come online before year-end, potentially exceeding 40 GW for 2025. Over 30% of new U.S. projects now integrate battery storage, signalling a strategic pivot toward dispatchable renewables.
Australia, though smaller in total capacity, continues to lead per capita solar adoption. The nation has crossed 38 GW installed, including over 20 GW of rooftop systems, the highest per capita in the world. Utility projects such as the Riverina Solar Hub and the revived Sun Cable demonstrate its ambition to export clean energy and pioneer agrivoltaic and hybrid solar-wind-battery systems. With state targets aiming for 82% renewables by 2030, Australia’s focus now shifts to transmission upgrades and green-hydrogen integration.
| Country | New Solar Capacity (GW) | % of Global Additions | Key Features |
|---|---|---|---|
| China | 256 | 67 | Gigawatt-scale solar bases, dominant manufacturing, rapid grid integration |
| India | 24 | 6 | Utility + agri solar expansion, strong domestic manufacturing push |
| United States | 21 | 5.5 | Hybrid solar + storage growth, grid bottlenecks |
| Australia | ≈4.5 | 1 | Highest per-capita solar rooftop, agrivoltaic innovation |
If planned additions are realised, 2025 will deliver 64 GW of new generation capacity in the U.S. alone, the highest since 2002. But unlike the gas-driven growth of that era, renewables now account for more than 90% of new capacity worldwide.
This shift marks more than technological progress; it represents a geopolitical re-ordering of energy leadership. Manufacturing, deployment, and policy ambition have pivoted decisively toward Asia. As China accelerates toward its 2030 carbon-peaking goal, its supply-chain reach is reshaping how nations build and trade clean-energy systems.
Such rapid expansion also exposes new bottlenecks. Integrating hundreds of gigawatts of intermittent power will demand massive investments in storage, transmission, and digital grid management. The next frontier lies in flexibility technologies from advanced batteries to green-hydrogen coupling that can stabilise renewables at continental scale.
Still, 2025 proves what coordinated policy and industrial capacity can achieve. The solar boom is more than an engineering triumph; it’s a demonstration of how quickly global priorities can shift when economics and climate goals align.
The story of 2025 isn’t just about how much solar was built, but where and how.
China leads in speed, India in accessibility, Australia in innovation, and the U.S. in hybridisation. Together, they reveal a simple truth: the clean-energy race is no longer regional, it’s the engine of global economic transformation.
Can the rest of the world match China’s pace or will leadership belong to those who master integration and innovation next?

Leave a Reply